

Shot table
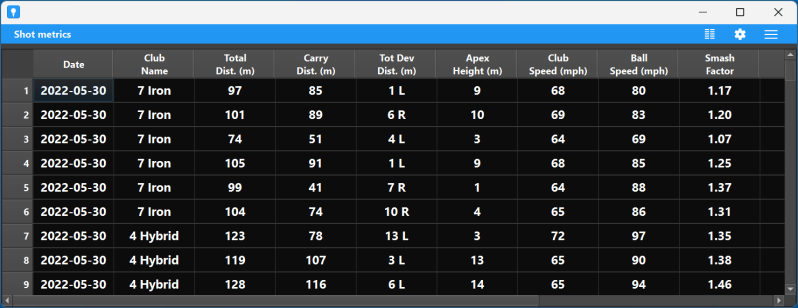
The shot table component show the metrics of all shots in the current selection. It also allows you to delete or change shots.
You can click on the column headers to sort the table based on that metric. By clicking multiple times you can switch between increasing and decreasing. So it is, for example, easy to take a look at your longest and shortest shots. You can easily change the width of the columns with the mouse, but this is not remembered when you go to another dashboard or close the app.
Note that for values that represent a deviation, like the deviation distance and side spin, an L at the end of the value means to the left, and an R means to the right. You can change this in the settings. Also in the settings you can indicate to show absolute values, so all numbers are positive and no direction is shown. This makes it possible to e.g. sort on the magnitude of the deviation, rather than the actual deviation.
You can select one or more shots by clicking on them. Use <Shift> or <Ctrl> to extend the selection. If there is also a driving range component in the dashboard, the selected shot(s) are indicated in the driving range as well.
If you right click on a shot row, a menu is shown. Here you have the following options:
- Show shot metrics. If you select this, a new window is shown containing a shot metrics component with metrics of the selected shot. You can show metrics of multiple shots to compare them.
- Show shot visuals. If you select this, a new window is shown containing a shot visuals component showing the ball flight trajectory and the impact in visual form. You can show visuals of multiple shots to compare them.
- Show shot video. If the shot has an associated video this is shown in a shot video component in a new window.
- Set video url. You can set or change the video associated with the shot. You can either provide an url (when the video is on the web) or a file name. You can also indicate whether you immediately want to show the associated video.
The menu
At the right of the title bar of the component there is a menu icon.
- Select all. Select all shots in the table.
- Clear selection. Unselect all shots.
- Delete shots. Only shown when one or more shots are selected. In this case also a delete icon appears in the title bar. You can click on this to delete the selected shots. A warning is given, indicating the number of shots that get deleted. Deleted shots are not really thrown away, but they are not shown anymore and are not used to compute analytics. It is not possible to undelete shots. But you can import them again and indicate the deleted shots should be re-added.
- Change club. Change the club for the selected shots. A dialog is shown that contains all existing clubs. You can select one of these and press the button to change the club. You can also press the button Add new club. You can now give the club a name and select the club type. Press Change the change the shot(s).
- Add tags. Each shot has tags associated with it. Here you can add tags for the selected shots by providing a comma-separated list. For details, see the help on tags.
- Remove tags. Remove the given tags (as a comma-separed list) from the shots.
- Clear tags. Cleat all tags from the selected shots.
- Move selection to session. Move the selected shots to a different session. You are shown a list of the available sessions from which you can pick on.
- Make selection new session. Create a new session out of the selected shots. You are asked to provide the name of the new session. Other session settings are copied.
- Select columns. Here you can select the columns to show. There is also an icon in the title bar for this. A form is shown with two lists. At the left you see the columns that are not yet shown and at the right you see the selected columns. You can select one or more of the columns and drag them to the other list. You can also drag them inside the list to change the order. Press the Select all button to select all columns and press the Clear button to remove them. Press one of the Sort buttons to place the columns in the default order. Press the Reset button to put the situation back to when you opened the dialog. Press OK when you are ready.
- Save as CSV file. This saves the table to a csv file that can e.g. be read into Excel to inspect further.
- Change settings. Change the settings. See below.
- Pop-out. Pop-out the table as a separate window.
Settings
The shot table component has a number of settings that you can change by clicking the settings icon in the title bar.
- Name. The name of the component.
- Title. The title shown in the title bar.
- Select columns. Select the columns to show in the table.
- Use absolute value. Show the absolute values of the metrics, where this is relevant. So you e.g. see the absolute deviation distance and side spin.
- Use simple value notation. Default, value that represent a direction get an L or R behind it to show that direction, rather than a negative or positive value. When checking this option they are simply number (negative or positive). Also the symbols for angles, percentages and inches are removed.
- Data. Here you can define a filter in the form of a formula. Only shots that satisfy the filter are shown in the table.
- Appearance. Here you can change the font size used for the cells and the headers, and whether they should be bold.
Note that there are buttons to reset the settings to the default (as defined in the dashboard) and to copy the settings from another shot table component.