

Metric values
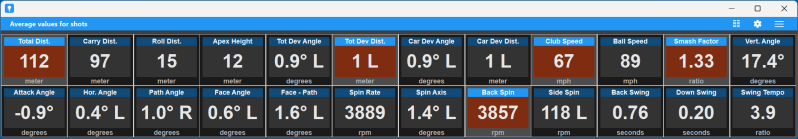
In the metric values component you get information about the average values for a number of metrics over all (selected) shots.
Each metric is shown in a box with the name of the metric, the average value, and the unit used. Some metrics might be more important to you than other and are more prominently shown. If you click on a metric you switch between important and not important. This is remembered between session. In the settings you can also indicate that you want to see something else than the average, for example the minimum or maximum.
If you want to change the order of the metrics or remove certain metrics, click on the table icon in the title bar, or select Select metrics in the menu. Here you can select the columns to show. A form is shown with two lists. At the left you see the metrics that are not yet shown and at the right you see the selected metrics . You can select one or more of the metrics and drag them to the other list. You can also drag them inside the list to change the order. Press the Select all button to select all metrics and press the Clear button to remove them. Press one of the Sort buttons to place the metrics in the default order. Press the Reset button to put the situation back to when you opened the dialog. Press OK when you are ready.
The menu in the title bar also has commands to save the component as a PNG image file, to change the settings, and to pop-out the component as a separate window.
Settings
The metric values component has a number of settings that you can change by clicking the settings icon in the title bar.
- General
- Name. The name of the component.
- Title. The title shown in the title bar. If you leave this empty the type of value is shown.
- Select metrics. Select the metrics to show in the component.
- Value. Here you can select what values you want to show. You have a number of options. Default the average value for the metric is shown. You can also show the minimum, maximum, range (that is max minus min), median (the middle value) and percentiles. The latter depends on the percentile setting. When you have a percentile of, say 25, percentile low will show the value of the metric that lies at 25%. Percentile high will show you the value at 75%.
- Exclude zero when computing values. When checked metric values of 0 are not used when calculating the average or other value. The rational is that 0 is used when the metric value is missing in the shot data. However, it will also ignore these values when they are valid, like a perfectly straight shot.
- Percentile. The percentile used when showing percentiles.
- Use absolute value. Show the absolute values of the metrics, where this is relevant. So you e.g. see the absolute deviation distance and side spin.
- Data. Here you can define a filter in the form of a formula. Only shots that satisfy the filter are taken into account in the chart.
- Appearance
- Max columns. The maximum number of columns to use. When set to 0 this is computed based on the shape of the component.
- Max rows. The maximum number of rows to use. When set to 0 this is computed based on the shape of the component.
Note that there are buttons to reset the settings to the default (as defined in the dashboard) and to copy the settings from another metric values component.